

Pipeline
Pipeline conversion rate and sales velocity: the metrics that matter
Win rate, stage conversion, and sales velocity: definitions, the formula, and how to read them without picking the wrong bottleneck.
Conversion rate says what share of opportunities moves forward. Pipeline velocity says how fast that movement produces revenue. Together they stop sales management from being run on a single large percentage.
Three rates you should not mix
| Metric | Calculation | What it shows |
|---|---|---|
| Stage conversion | Deals moved to the next stage ÷ deals that entered the stage | Where volume drops |
| Win rate | Won ÷ (won + lost) | The quality of deals you agree to close |
| Win rate on the open pipe | Won ÷ opportunities still open | A misleading mix: the denominator changes every day |
Do not include still-open deals in the win rate. A young pipe otherwise shows an artificially low number. Wait until a cohort is closed, or calculate on opportunities created more than one median cycle ago.
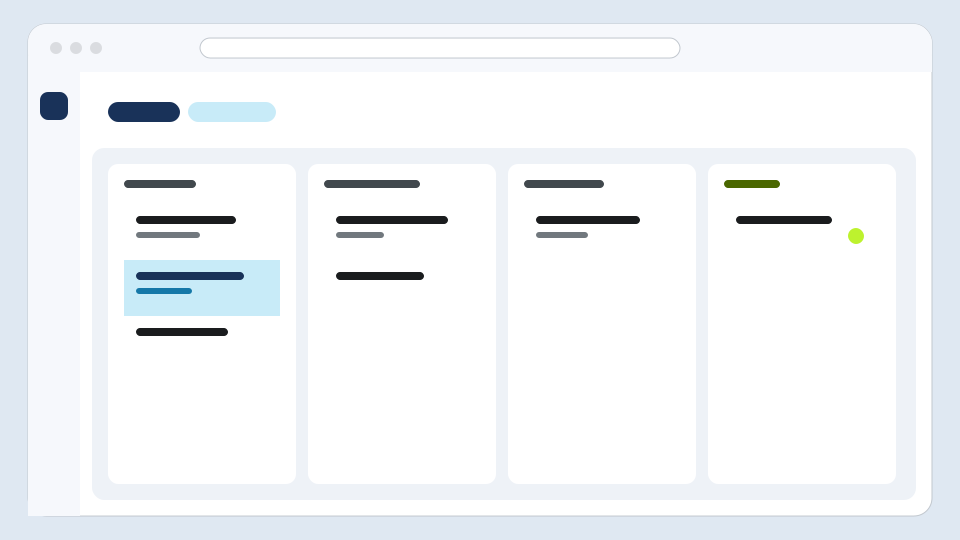
The sales cycle supplies duration. Columns supply the stages you compare.
The velocity formula
Velocity = opportunities × win rate × average deal size ÷ cycle length.
Example: 40 opportunities a quarter, 25 percent win rate, 8,000 average deal, 2-month cycle.
- 40 × 0.25 × 8,000 = 80,000 on that stock of deals.
- Divided by 2 months: 40,000 per month.
Each lever has a different cost:
- More opportunities: prospecting. Useless if qualification is weak.
- Better win rate: qualify better, discover better, disqualify sooner. See BANT and MEDDIC.
- Higher deal size: offer and scope, not a CRM field.
- Shorter cycle: a dated next action and less WIP. That is the Kanban method.
Read a bottleneck without inventing a story
A sharp drop between proposal and negotiation means the offer arrives too early or too vague. A drop between negotiation and won means the decision maker or the buying process is missing. A decent win rate with weak velocity often means cards sit too long: follow-up tracking and the weekly review are the first levers.
The forecast uses these rates to replace gut-feel probabilities. While history is thin, say so: a win rate on eight deals is not a law.
Bottom line
Measure conversion by stage, win rate on closed deals, and velocity with the full formula. Adding prospects while the bottleneck is negotiation fills the board without raising revenue. The pipeline inside Gmail shows those stages on real threads, not on a monthly export.
Frequently asked questions
What is the sales velocity formula?
Velocity = number of opportunities × win rate × average deal size ÷ cycle length. With the cycle in months, the result is revenue per month.
Are win rate and conversion rate the same?
No. Win rate is the share of finished opportunities that are won. Stage conversion is the share of deals that move from one column to the next.
Which metric should you improve first?
The one at the real bottleneck. A low win rate with a very long cycle is not the same problem as an empty pipe upstream. Read conversion at each stage before adding more prospecting.